
Support and Resistance are two terminologies that are frequently used in market analysis and news. When the market or scrip starts moving in a positive territory, people talk about the probable levels of resistance where the northbound movement could pause or reversal of the upward trend occur. Inversely, as the market or scrip starts southbound movement, people start to look for support—a point or level where market decline could pause or reversal of the downward trend could ensue.
Stock traders/investors like to know of such support and resistance levels to set-up their trading/investing strategies. These levels/points on a chart help people make better decisions for profit booking at resistance levels and new accumulations at support levels.
Support is a price or index level in the chart where the price/index has higher probability of finding support as it falls. As the price starts to fall, buyers feel the scrip is getting cheaper. The temptation to buy increases. Buying interest continues to grow as the price gets further discounted. At a certain price level, demand gets concentrated and a support level is formed. The buying concentration exhausts the selling pressure and the price fall pauses.
As buying continues, supply starts to diminish. With less supply and more demand, the price will stabilize and help bounce off the price from this level. But if the price breaks through this level, buyers will pause to buy in anticipation of further discount while sellers will increase the supply in anticipation of stopping further loss. This will fuel further decline and this process will continue till a next level of support is not reached.
There are different technical methods of identifying support levels. A simple and commonly used method is to observe the historical price movement in the chart, and identify the points where the price has stabilized and bounced off from, on multiple occasions. The method entails identifying a level where the price got support at least two times in the past. If there is a history of finding support at the same level on multiple occasions, then such a level is considered a stronger support level. 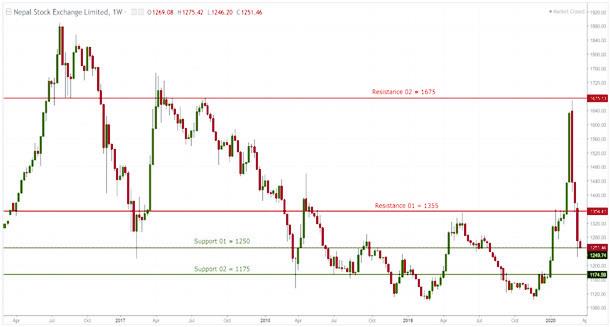
|
NEPSE Weekly Chart: Major Support and Resistance Levels |
Resistance is the opposite of support level. As the price of scrip increases, sellers start to feel the scrip is getting expensive and their profit margin is getting higher. Higher the price increase, higher will be the profit margin. With every increase in the price level, more and more sellers get tempted to sell and book profit. At a certain price level, all these supply gets concentrated and a resistance level is built. This is where the buying is exhausted, the price increase pauses and a reversal of the uptrend happens.
As with the support level, if the price breaks through this resistance level, the sellers will pause the supply with the anticipation of selling their scrip for more premium, while more and new buyers will come with the anticipation of profit to be made. This will help with further increment of price till a next level of support is met.
Resistance is identified as a price level where the price got resisted at least two times in the past. If it was resisted more than twice, the level can be considered a strong resistance. Any resistance, if breached, automatically converts into an immediate support. Similarly, if a support level is broken, it will start to work as the resistance in the future.


